SDG drinking water and sanitation progress is too slow
The World Health Organization and the United Nations Children Fund have released a joint report highlighting the need to accelerate progress in providing people with access to drinking water, sanitation and hygiene (WASH) services.
Household WASH progress since 2000
The report, titled Progress on household drinking water, sanitation and hygiene, 2000-2024, Special focus on inequalities, was produced by the Joint Monitoring Programme for Water Supply, Sanitation and Hygiene (JMP).
It updates the most recent report, which was focused on WASH in schools and in health care facilities (2000–2023). The latest report presents updated national, regional and global estimates for WASH in households for the period 2000–2024, monitored against the 2030 Agenda for Sustainable Development’s ambitious global targets for universal access to basic services and for universal access to safe drinking water, sanitation and hygiene.
WASH indicators are available forbenchmarked and compared between countries and regions.
With just five years left of the original target period, the latest report reveals a stark truth:
‘The world is still not on track to achieve universal coverage of basic WASH services by 2030, and universal coverage of safely managed water and sanitation services is increasingly out of reach.’
In revealing the slow and unequal progress being made to provide all humans with basic drinking water, hygiene and sanitation needs, the report reveals common goals where policy, investment, technology and entrepreneurs can make a real difference to people’s everyday lives.
Some progress made, but too slow to meet goals
Approximately a quarter of the world’s population gained access to safely managed drinking water, and a third gained access to safely managed sanitation services, between the years 2000 and 2024. During the same period, the global population increased by two billion people.
Since the start of the Sustainable Development Goals (SDG) period in 2015, more than 961 million people have gained safely managed drinking water. However, progress has been uneven among regions and has begun to slow.
Access to drinking water
Access to drinking water is based on the following levels:
- Safely managed: Drinking water from an improved source that is accessible on premises, available when needed and free from faecal and priority chemical contamination
- Basic: Drinking water from an improved source, provided the collection time is not more than 30 minutes for a round trip, including queuing
- Limited: Drinking water from an improved source, for which the collection time exceeds 30 minutes for a round trip, including queuing
- Unimproved: Drinking water from an unprotected dug well or unprotected spring
- Surface water: Drinking water directly from a river, dam, lake, pond, stream, canal or irrigation canal.
According to the report, among the 2.1 billion people still lacking access to safely managed drinking water in 2024, two-thirds (1.4 billion) had a basic service, 287 million used limited services, 302 million used unimproved sources and 106 million still used surface water (61 million fewer people used surface water than in 2015).
Other key headline statistics from the report include:
- Since 2015, 961 million people have gained access to safely managed drinking water services. Coverage has increased from 68 per cent to 74 per cent, rising from 50 per cent to 60 per cent in rural areas and remaining level at 83 per cent in urban areas.
- The number of people using surface water for drinking has decreased by 61 million.
- In 2024, 89 countries had already achieved universal access (>99 per cent) to at least basic drinking water services. Thirty-one countries have achieved universal access to safely managed services, and if current trends continue, 38 will have reached universal access by 2030.
- The region of Australia and New Zealand has already achieved universal access to basic drinking water services, and the Latin America and the Caribbean region is on track to achieve universal access by 2030.
- However, the overall rate of progress will need to increase threefold to meet the global SDG target 1.4. No SDG region is on track to achieve universal access to safely managed services, and the overall rate of progress will need to increase eightfold to meet the global SDG target 6.1.
Sanitation access rates need to increase significantly
Access to sanitation is assessed against the following levels:
- Safely managed: Use of improved facilities that are not shared with other households and where excreta are safely disposed of in situ or removed and treated off-site.
- Basic: Use of improved facilities that are not shared with other households.
- Limited: Use of improved facilities that are shared with other households.
- Unimproved: Use of pit latrines without a slab or platform, hanging latrines or bucket latrines.
- Open defecation: Disposal of human faeces in fields, forests, bushes, open bodies of water, beaches or other open places, or with solid waste.
The headline statistics from the report include:
- Since 2015, 1.2 billion people have gained access to safely managed sanitation services.
- The population practising open defecation has decreased by 429 million, and in urban areas, it has been eliminated (99 per cent) to at least basic sanitation services.
- Nine countries had already achieved universal access (>99 per cent) to safely managed services, and if current trends continue, 18 will have reached universal access by 2030.
- The region of Australia and New Zealand has already achieved universal access to basic sanitation services, and the Eastern and South-Eastern Asia region is on track to achieve universal access by 2030.
- However, as with drinking, the overall rate of progress will need to increase threefold to meet the global SDG target 1.4.
- No SDG region is on track to achieve universal access to safely managed services by 2030, and the overall rate of progress will need to increase sixfold to meet the global SDG target 6.2a.
- In 2024, 3.4 billion people still lacked safely managed sanitation services, including 1.9 billion with basic services, 560 million with limited services, 555 million with unimproved services, and 354 million practising open defecation.
Hygiene progress needs to double
Hygiene, as the report notes, encompasses a broad range of factors relating to health, such as bodily health, environmental health, and the broader health of a community.
While the main focus of global monitoring has been on hand hygiene, this report introduces indicators related to bathing facilities in the home and an increased focus on menstrual health and hygiene.
Access to hygiene is assessed against the following levels:
- Basic: Availability of a handwashing facility with soap and water at home.
- Limited: Availability of a handwashing facility lacking soap and/or water at home.
- No facility: No handwashing facility at home.
The headline statistics from the report include:
- Since 2015, 1.6 billion people have gained access to basic hygiene services.
- In 2024, four countries had already achieved universal access (>99 per cent) to basic hygiene services, and another nine countries were on track to achieve universal access by 2030.
- One SDG region (Central and Southern Asia) is on track to achieve universal access to basic hygiene services by 2030.
- However, the overall rate of progress will need to double to meet the global SDG targets 1.4 and 6.2b.
- In 2024, 1.7 billion people still lacked basic hygiene services, including 1 billion with limited services and 611 million with no service.
Highlighting the inequalities of access to WASH services
According to the report, to achieve universal access to basic WASH services (SDG 1.4), lower-middle-income countries need to double current rates of progress, and low-income countries would require a dramatic sevenfold increase in basic water and an 18-fold increase in basic sanitation and basic hygiene.
Other inequalities highlighted include:
- Subnational data in the report reveals that WASH service levels often vary widely between rural and urban, subnational regions, richest and poorest, and ethnic groups.
- Individual-level data on time spent collecting water highlight inequalities between women and girls and men and boys.
Emerging data on other dimensions of inequality show WASH service levels also vary between communities with and without access to roads, between different types of households, between minority ethnic and indigenous groups and the general population, and between individuals with and without functional disabilities.
Global Water Organization provides collaborative solutions to water-related challenges
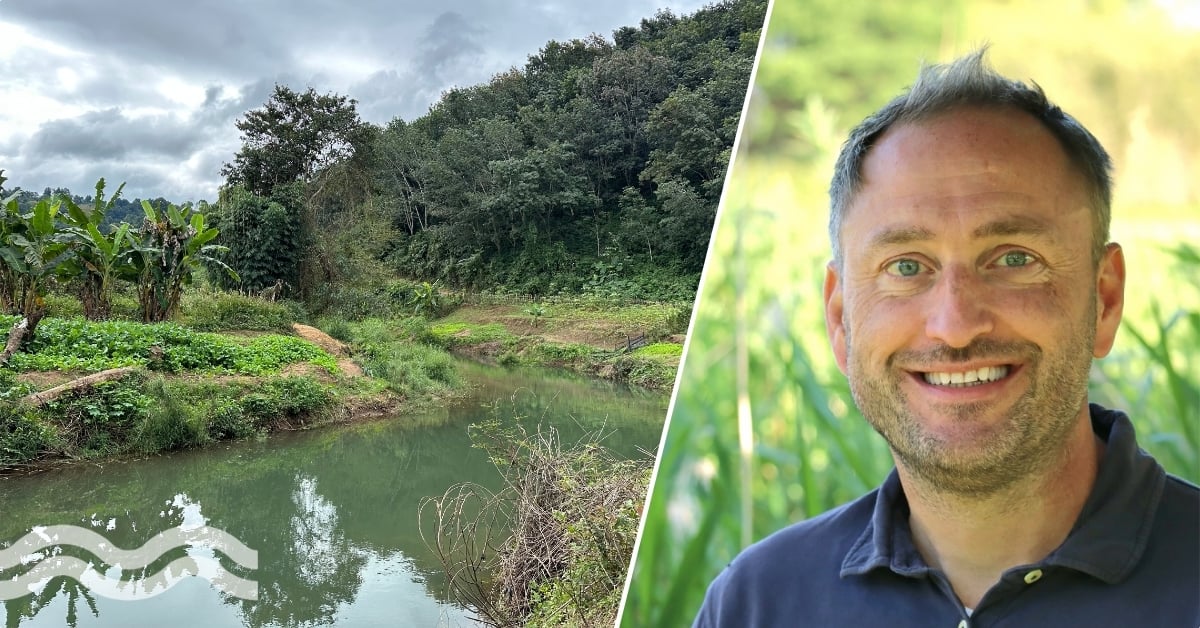
Compact treatment plant brings security to rural Laos
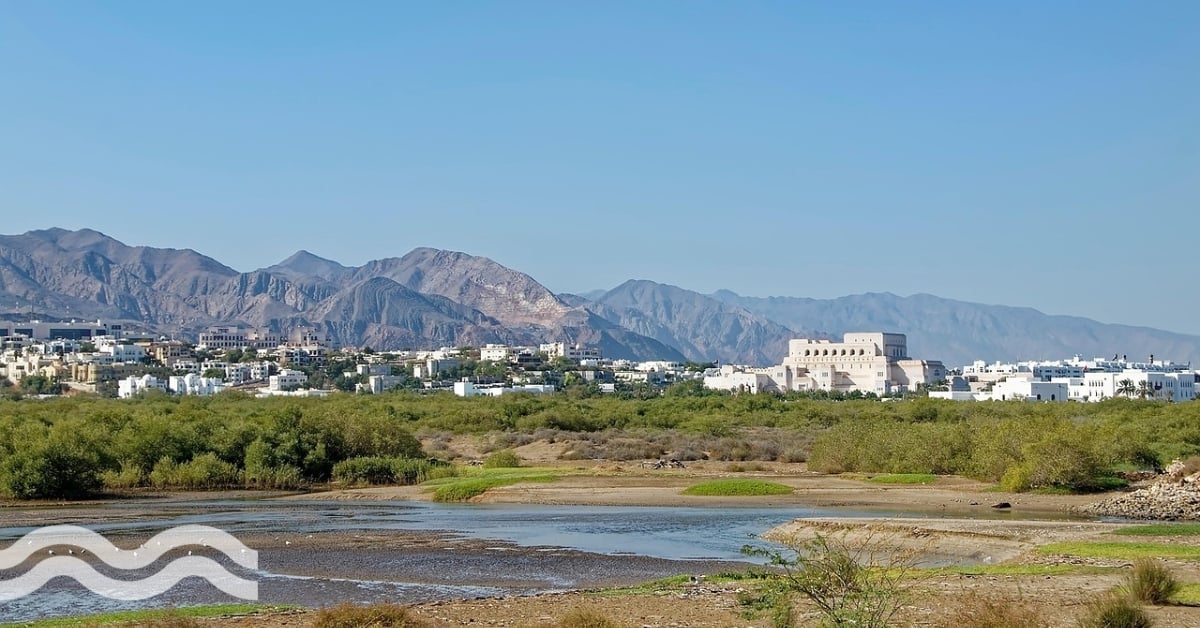
Purification plant strengthens security in Oman
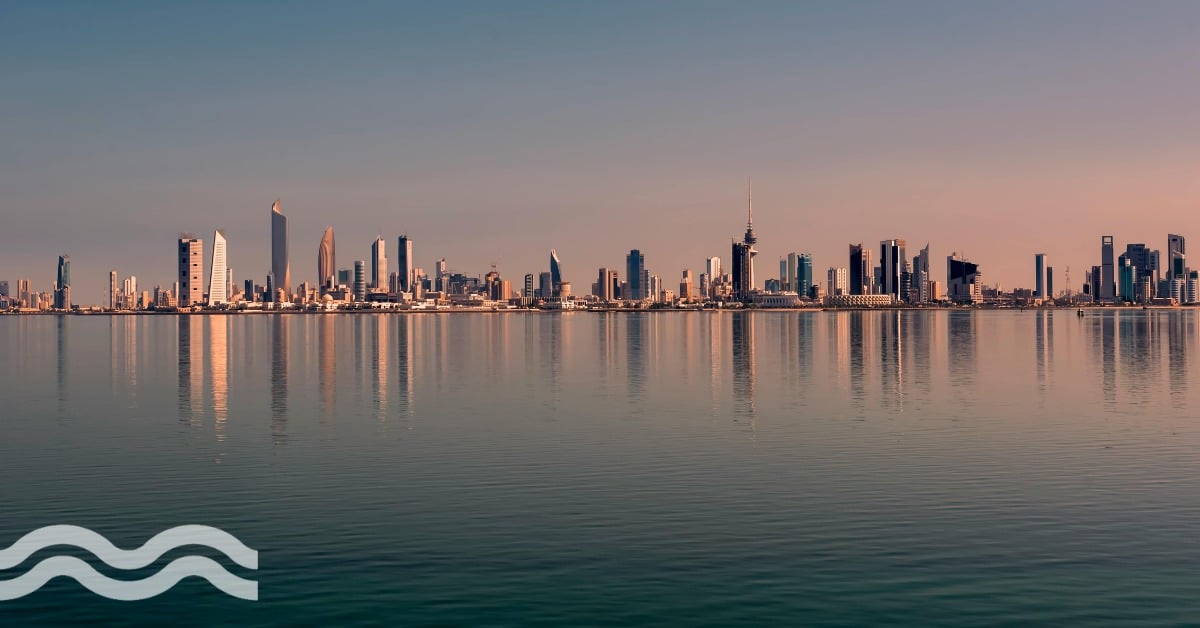
Is water and power integration the future of desalination in Kuwait?